
Page 7 - Profile's Stock Exchange Handbook - 2025 Issue 3
P. 7
Profile’s Stock Exchange Handbook: 2025 - Issue 3 About the Stock Exchange Handbook
The Sector Table includes the JSE code, year end, The various databases from which the Stock
next results, market cap, P/E, market beta, volatility Exchange Handbook is compiled are updated on
and rand value traded per week. A sector total is virtually a real-time basis. Our ShareData system, from
provided for market cap, and averages for P/E and which the handbook’s financial statistics are drawn,
market beta. is updated on a daily basis, and we receive earnings
The Corporate Events Table provides a summary estimates from stockbroking firms on a weekly basis.
of new listings, delistings, name changes, sector The Stock Exchange Handbook represents a ‘snapshot’
changes, splits, and consolidations that took place of these highly up-to-date databases as close to the
between issues of the Stock Exchange Handbook. print deadline as possible.
Readers can access up-to-date information at www.
Compilation of the Stock sharedata.co.za.
Exchange Handbook Sources of Information
Publication Cycle ProfileData, which incorporates the research
division of the Profile Group, is a primary data
The Stock Exchange Handbook is published in source, and most of our information is researched
February, May, August and November each year. independently and drawn directly from each
Reporting of results by JSE listed companies is company’s own reports and accounts. SENS notices,
currently concentrated in three distinct periods – published financials and other announcements are
March-May, August-September, and November. processed on a real-time basis.
The publication of four books per year enhances the
inclusion of recently published results even further.
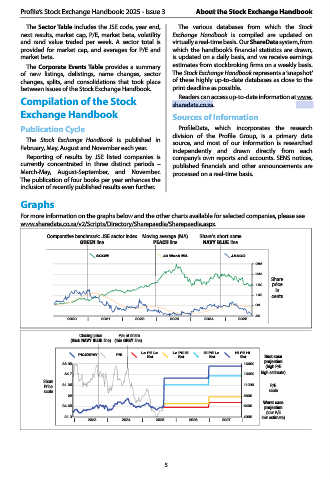
Graphs
For more information on the graphs below and the other charts available for selected companies, please see
www.sharedata.co.za/v2/Scripts/Directory/Sharepaedia/Sharepaedia.aspx.
Comparative benchmark: JSE sector index Moving average (MA) Share’s short name
GREEN line PEACH line NAVY BLUE line
SCOM 40 Week MA JASCO
286
238
Share
190 price
in
142 cents
94
46
2020 | 2021 | 2022 | 2023 | 2024 | 2025
Closing price P/E of share
(thick NAVY BLUE line) (thin GREY line)
PICKNPAY P/E Lo PE Lo Lo PE Hi Hi PE Lo Hi PE Hi
Est Est Est Est Best case
38.05 16000 projection
(high P/E
high estimate)
34.7 13600
Share
Price 31.35 11200 P/E
scale scale
28 8800
Worst case
24.65 6400 projection
(low P/E
21.3 4000 low estimate)
| 2023 | 2024 | 2025 | 2026 | 2027 |
5