
Page 58 - Profile's Stock Exchange Handbook - 2025 Issue 3
P. 58
JSE Sector Table Profile’s Stock Exchange Handbook: 2025 - Issue 3
JSE Sector Table
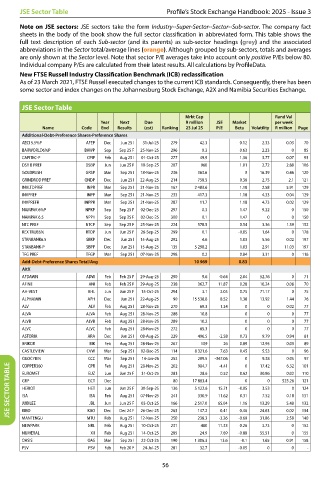
Note on JSE sectors: JSE sectors take the form Industry--Super-Sector--Sector--Sub-sector. The company fact
sheets in the body of the book show the full sector classification in abbreviated form. This table shows the
full text description of each Sub-sector (and its parents) as sub-sector headings (grey) and the associated
abbreviations in the Sector total/average lines (orange). Although grouped by sub-sectors, totals and averages
are only shown at the Sector level. Note that sector P/E averages take into account only positive P/Es below 80.
Individual company P/Es are calculated from their latest results. All calculations by ProfileData.
New FTSE Russell Industry Classification Benchmark (ICB) reclassification
As of 23 March 2021, FTSE Russell executed changes to the current ICB standards. Consequently, there has been
some sector and index changes on the Johannesburg Stock Exchange, A2X and Namibia Securities Exchange.
JSE Sector Table
Mrkt Cap Rand Val
Year Next Due R million JSE Market per week
Name Code End Results (est) Ranking 23 Jul 25 P/E Beta Volatility R million Page
Additional-Debt-Preference Shares-Preference Shares
AECI 5.5%P AFEP Dec Jun 25 I 31-Jul-25 279 42.3 0.12 2.33 0.03 70
BARWORLD6%P BAWP Sep Sep 25 F 25-Nov-25 296 0.3 0.63 2.23 0 85
CAPITEC-P CPIP Feb Aug 25 I 01-Oct-25 277 49.9 1.36 3.77 0.07 93
DSY B PREF DSBP Jun Jun 25 F 19-Sep-25 207 960 1.01 2.72 2.88 106
GOLDRUSH GRSP Mar Sep 25 I 18-Nov-25 236 363.6 0 16.39 0.46 120
GRINDROD PREF GNDP Dec Jun 25 I 22-Aug-25 214 758.5 0.36 2.75 2.1 121
INVLTDPREF INPR Mar Sep 25 I 21-Nov-25 167 2 483.6 1.18 2.58 5.91 129
INVPREF INPP Mar Sep 25 I 21-Nov-25 233 417.3 1.18 4.33 0.04 129
INVPREFR INPPR Mar Sep 25 I 21-Nov-25 287 11.7 1.18 4.73 0.02 129
NAMPAK 6%P NPKP Sep Sep 25 F 02-Dec-25 297 0.3 1.47 9.22 0 150
NAMPAK 6.5 NPP1 Sep Sep 25 F 02-Dec-25 300 0.1 1.47 0 0 150
NTC PREF NTCP Sep Sep 25 F 25-Nov-25 224 578.5 0.54 3.36 1.39 152
REX TRUE6% RTOP Jun Jun 25 F 26-Sep-25 299 0.1 -0.05 1.64 0 178
STANBANK6.5 SBKP Dec Jun 25 I 15-Aug-25 292 4.6 1.03 5.56 0.02 197
STANBANK-P SBPP Dec Jun 25 I 15-Aug-25 135 5 298.2 1.03 2.91 11.03 197
TFG PREF TFGP Mar Sep 25 I 07-Nov-25 298 0.2 0.84 3.31 0 116
Add-Debt-Preference Shares Total/Avg 10 969 0 .83
AltX
AFDAWN ADW Feb Feb 25 F 29-Aug-25 290 9.6 -0.64 2.04 52.76 0 71
AFINE ANI Feb Feb 25 F 29-Aug-25 238 362.7 11.87 0.28 10.24 0.08 70
AH-VEST AHL Jun Jun 25 F 15-Oct-25 294 3.1 2.05 0.75 71.17 0 75
ALPHAMIN APH Dec Jun 25 I 22-Aug-25 90 15 538.8 8.52 1.38 13.92 1.44 76
ALV ALV Feb Aug 25 I 28-Nov-25 270 69.3 1.34 0 0 0.02 77
ALVA ALVA Feb Aug 25 I 28-Nov-25 288 10.8 0 0 0 77
ALVB ALVB Feb Aug 25 I 28-Nov-25 289 10.2 0 0 0 77
ALVC ALVC Feb Aug 25 I 28-Nov-25 272 65.3 0 0 0 77
ASTORIA ARA Dec Jun 25 I 08-Aug-25 229 496.5 -2.58 0.73 9.79 0.94 81
BRIKOR BIK Feb Aug 25 I 28-Nov-25 267 109 26 0.89 12.95 0.03 89
CASTLEVIEW CVW Mar Sep 25 I 02-Dec-25 114 8 321.6 7.63 0.45 5.53 0 96
Sep 25 I
CILOCYBIN CCC Mar Aug 25 I 28-Nov-25 253 209.5 -347.06 0.62 0 0 17.42 0.05 101
14-Jan-26
97
9.38
JSE SECTOR TABLE JUBILEE GCT Dec Jun 25 F 30-Sep-25 136 17 883.4 15.71 -0.05 0 13.29 0 523.26 0 121
Feb
6.32
984.7
202
-4.41
CPR
COPPER360
EUROMET
31-Oct-25
Jun 25 F
110
0.52
30.86
0.02
283
28.6
Jun
EUZ
GRP
80
3.53
124
HERIOT
HET
Jun
Jun 25 F
5 122.6
241
11.62
ISA
330.9
0.18
131
7.52
Feb
07-Nov-25
Aug 25 I
ISA
0.31
65.04
1.16
2 517.0
166
03-Oct-25
5.48
JBL
132
Jun
KBO
0.41
0.46
KIBO
12-Nov-25
31.86
140
Aug 25 I
Feb
MANTENGU
2.58
-3.26
238.3
250
152
3.73
Feb
Aug 25 I
NEWPARK MTU Dec Dec 24 F 26-Dec-25 263 147.2 11.33 -0.69 24.63 0.02 0 134
NRL
10-Oct-25
480
231
0.26
NUMERAL XII Feb Aug 25 I 14-Oct-25 285 24.9 7.69 -0.88 55.51 0 155
OASIS OAS Mar Sep 25 I 22-Oct-25 190 1 306.3 13.6 -0.1 1.65 0.91 158
PSV PSV Feb Feb 20 F 24-Jul-25 281 32.7 -0.05 0 0 -
56