
Page 55 - Profile's Stock Exchange Handbook - 2025 Issue 2
P. 55
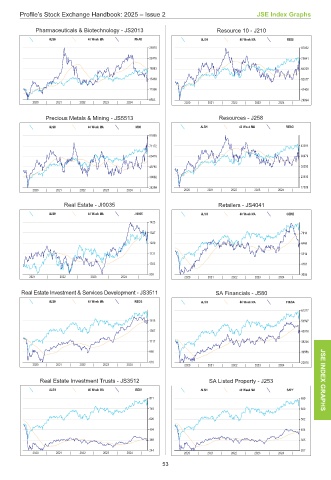
Profile’s Stock Exchange Handbook: 2025 – Issue 2                  JSE Index Graphs

           Pharmaceuticals & Biotechnology - JS2013            Resource 10 - J210
               ALSH       40 Week MA   PHAR               ALSH       40 Week MA    RESI
                                           25970                                       87052
                                           22476                                       75641
                                           18983                                       64229
                                           15489                                       52817
                                           11996                                       41406
                                           8503                                        29994
          2020  |  2021  |  2022  |  2023  |  2024  |  2020  |  2021  |  2022  |  2023  |  2024  |
              Precious Metals & Mining - JS5513                Resources - J258
               ALSH       40 Week MA    MINI              ALSH       40 Week MA   RESO
                                           81865
                                           71172                                       43391
                                           60479                                       36870
                                           49785                                       30350
                                           39092                                       23830
                                           28399                                       17309
          2020  |  2021  |  2022  |  2023  |  2024  |  2020  |  2021  |  2022  |  2023  |  2024  |
                   Real Estate - JI0035                        Retailers - JS4041
               ALSH       40 Week MA   JI0035             ALSH       40 Week MA   GERE
                                           1425
                                           1327                                        7618
                                           1229                                        6466
                                           1131                                        5314
                                           1033                                        4161
                                           935                                         3009
         2021  |  2022  |  2023  |  2024  |          2020  |  2021  |  2022  |  2023  |  2024  |

       Real Estate Investment & Services Development - JS3511  SA Financials - J580
               ALSH       40 Week MA   REDS               ALSH       40 Week MA   FINSA
                                                                                       61277
                                           1618                                        53597
                                           1367                                        45916
                                           1117                                        38236
                                           866                                         30556  JSE
                                           616                                         22875
          2020  |  2021  |  2022  |  2023  |  2024  |  2020  |  2021  |  2022  |  2023  |  2024  |  INDEX
            Real Estate Investment Trusts - JS3512          SA Listed Property - J253
               ALSH       40 Week MA   REIV               ALSH       40 Week MA    SAPY
                                            871                                        699  GRAPHS
                                            745                                        600
                                            620                                        502
                                            494                                        404
                                            369                                        305
                                            244                                        207
          2020  |  2021  |  2022  |  2023  |  2024  |  2020  |  2021  |  2022  |  2023  |  2024  |
                                               53