|
Registration Successful. Thank you for registering.
We have emailed a password to
Please check your email, enter the password we've sent you and click LOGIN to continue.
|
|
You need to be logged on as a free registered user or subscriber for this link.
Please log in or see below for free registration, subscription or free trial.
|
|
You need a premium subscription for this link to work.
Please see below for free registration, premium subscription or free trial.
|
|
|
(For free registration, leave blank and click Login) |
|
|
| Forgotten your password? |
|
| Having trouble with this screen? Email us or phone 011-728-5510 |
|
 |
|
Need a password? Registration is FREE!
Just enter an email address above and click the LOGIN button (leave the password field blank) |
|
| |
| | Free registration is required to access customise options, watchlists, portfolios and the alert service so that we can protect your privacy and keep track of your selections. We undertake never to abuse your email address.
If you are an ex-subscriber, free trial user or newsletter recipient you are automatically a free user – just click here and we'll email you a password reminder.
If you've never registered before, enter an email address above (leave password field blank) and click LOGIN - we'll send you a password immediately. |
| |
|
|
|
Need a subscription?
Take the inside track, become a PREMIUM user |
|
| Subscribers to ShareData Online have access to professional-level information – the same data used by financial markets specialists and fund managers. Subscription rates for private investors are very reasonable – the equivalent of a weekly grande latte. |
| |
| Click here for the subscription sign-up page |
|
|
|
|
Or sign up for a free trial...
Full access for 10 days, no strings attached |
|
| | If you'd like to preview our PREMIUM content, please sign up for a free trial. |
| |
| | We do NOT ask for credit card details. At the end of the free trial, if you choose not to subscribe, you will automatically be a free registered user with access to watchlists, portfolios and alerts. |
| |
| | The free trial gives full access to all of ShareData Online for 10 days. |
| |
| | Please click here for the free trial sign-up page. |
|
Email address
When you click the 'Send' button an email will be sent to the above email address
containing the password that is registered for the email address.
ShareData Online is currently in use on another computer that logged in with the email address .
That computer last accessed ShareData Online on .
To use ShareData Online on this computer do one of the following:
- Select Logoff from the Admin menu on the other computer
- Or wait for 1 hour of no activity on the other computer
For more information see the Conditions of Subscription in the Terms of Use for ShareData Online.
"Each login and password is provided for the exclusive use of a single
individual for use on a single workstation per login. The Subscriber undertakes
that each login shall be used by one individual on one computer, workstation or
device at a time, and further undertakes not to disclose login details to other
persons."
|
|
|
|
| Time | Price | VWAP* | Volume | | 17:06 | 1,006.70 | 1,006.38 | 44 457 | | 16:49 | 1,006.94 | 1,006.33 | 13 | | 16:49 | 1,007.52 | 1,006.33 | 38 | | 16:48 | 1,007.57 | 1,006.33 | 102 | | 16:48 | 1,007.03 | 1,006.33 | 200 | | 16:48 | 1,007.04 | 1,006.33 | 100 | | 16:48 | 1,007.11 | 1,006.33 | 119 | | 16:48 | 1,007.11 | 1,006.33 | 160 | | 16:48 | 1,007.05 | 1,006.33 | 120 | | 16:48 | 1,007.05 | 1,006.33 | 93 | | 16:48 | 1,007.02 | 1,006.33 | 138 | | 16:48 | 1,007.02 | 1,006.33 | 203 | | 16:48 | 1,007.23 | 1,006.33 | 32 | | 16:48 | 1,007.23 | 1,006.33 | 85 | | 16:48 | 1,007.23 | 1,006.33 | 83 | | 16:48 | 1,006.86 | 1,006.33 | 57 | | 16:48 | 1,006.86 | 1,006.33 | 22 | | 16:48 | 1,007.56 | 1,006.33 | 306 | | 16:48 | 1,007.56 | 1,006.33 | 77 | | 16:48 | 1,007.56 | 1,006.33 | 136 | | * Volume Weighted Average Price |
|
|
|
|
| Market Capitalisation |
2 302.95bn |
| Unissued Shares |
570.65m |
| EPS - last reported |
3 726.30 |
| EPS - TTM |
7 210.05 |
| EY (Earnings Yield) |
7.16 |
| DPS - last dividend |
(GBP) 0.61 |
| DPS - TTM |
5354.22 |
| DY (Dividend Yield) |
5.32 |
| P/E (Price/Earnings) |
13.96 |
| Price/NAV |
2.01 |
|
| More valuation data |
|
|
|
|
| Friday's Last Trade |
1,006.70 |
 |
| Thursday's Close |
991.50 |
|
| Day's Move |
+15.20 (+1.53%) |
|
| Best Bid Now |
– |
|
| Best Bid Volume |
|
|
| Best Offer Now |
– |
|
| Best Offer Volume |
|
|
| Friday's Trades |
3 377 |
|
| Friday's Volume Traded |
320 687.00 |
|
| Friday's Value Traded |
R 322.73m |
|
| Friday's Open |
965.00 |
 |
| Friday's High |
1,015.35 |
|
| Friday's Low |
965.00 |
|
|
|
|
|
| Click column headers to sort |
Customise |
|
|
|
| 1 week | -2.85% | 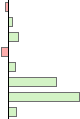 | 14.4 | | 1 month | +4.2% | 13.4 | | 3 months | +10.76% | 12.6 | | 6 months | -6.99% | 14.0 | | 1 year | +7.28% | 34.8 | | 2 years | +50.63% | 8.2 | | 3 years | +74.37% | 7.1 | | YTD | +8.86% | 34.3 |
|
| More performance data |
| Avg volume per day |
598 634.35 |
600 387.35 |
672 071.93 |
| Avg value per day |
561.88m |
576.44m |
646.85m |
| Avg volume per week |
2.78m |
2.87m |
3.17m |
| Avg value per week |
2.61bn |
2.75bn |
3.05bn |
| Period High Price |
1061.95 |
1104.35 |
1111.12 |
| Period Low Price |
868.88 |
868.88 |
868.88 |
|
|
|
|
|